We will discuss power of Moving average in stock Market.
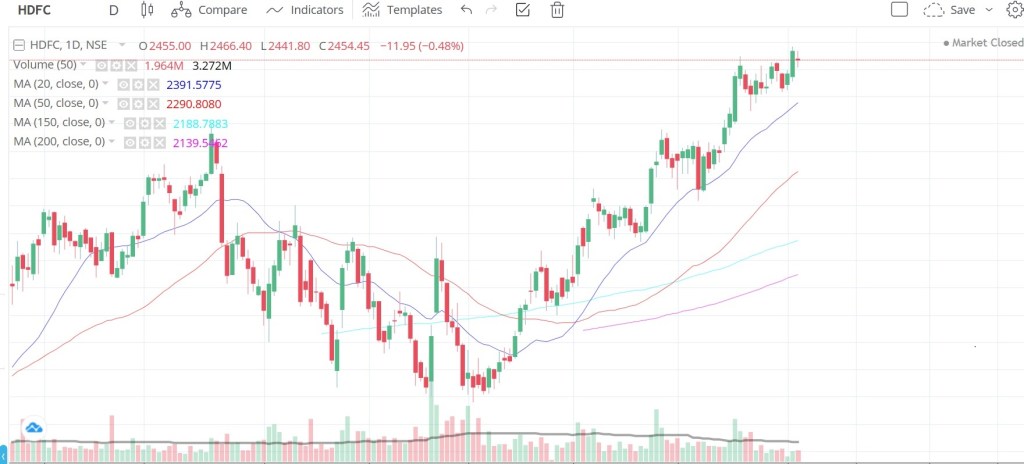
Mainly we will discuss the following moving average: 20 day moving average, 50 day moving average, 150 day moving average and 200 day moving average.
So what is moving average? Every day stock market closed at certain price for certain scrips. When we take last 20 days closing price and divide by 20 we find one price level and will plot in chart. That is the way we are getting last 20 days average stock movement. When we are continuing following this we get one lone in chart called 20 days moving average. The same way we find 50 day, 150 day, 200 day moving average.
20 Days Moving average: It is the short term trend. We will buy the stocks which are above 20 ma and 20 ma should be inclined up.
50 Days Moving average: It is the trend following. Once 50 ma is inclined up it says that market is bullish. Ideal case both 20 ma and 50 ma will be inclined upwars and 20 ma should be above 50 ma.
150 Days Moving average: This is medium term trend following indicator. When you are in buy side please ensure that stock price is above 20 ma, 50 ma and 150 ma. It also should be in upward inclination for the past 4-5 months.
200 Days Moving average: This is the grand daddy of all. If the stock price is below 200 ma means the stock has severe problem. Either earnings are bad, company is going through major break down. Always buy a stock when the stock price is above 200 ma.
Ideal buying condition: stock is above 20 ma, above 50 ma, above 150 ma, above 200 ma. 20 ma is above 50 ma, 50 ma is above 150 ma, 150 ma is above 200 ma and all moving average is inclined upwards.